Portfolio monitoring and credit deterioration
Track cohorts, concentrations, migrations, and actions after approval.
A lender’s average delinquency rate stays flat. Underneath it, a new group of merchants is deteriorating while an older group pays down. An average can be accurate and still conceal the most useful story.
Use vintages and comparable age
A vintage groups accounts or loans by origination period. Compare vintages at equal months on book so each has had similar time to develop losses. New accounts naturally have less observed history.
Track both account counts and balances. A small number of large defaults can matter more financially than many small late payments. State whether a rate uses original balance, current balance, or account count. Cohort definitions should remain stable through reporting changes; otherwise, a chart can improve because the denominator changed rather than because the portfolio improved.
A vintage groups accounts or transactions by their starting period. Comparing vintages at the same age helps separate the effect of time from the effect of underwriting changes. A newly approved group has had fewer opportunities to miss payments than a group observed for a year. Its lower cumulative loss is therefore not sufficient evidence of better quality.
Use a consistent definition of cohort entry, exposure, observation age, and loss. If a borrower refinances or a merchant changes terms, define how the analysis treats that event. Otherwise, a policy change can appear to improve results simply by moving difficult accounts out of the measured population. Keep the operational view of today’s portfolio alongside the historical view of comparable cohorts.
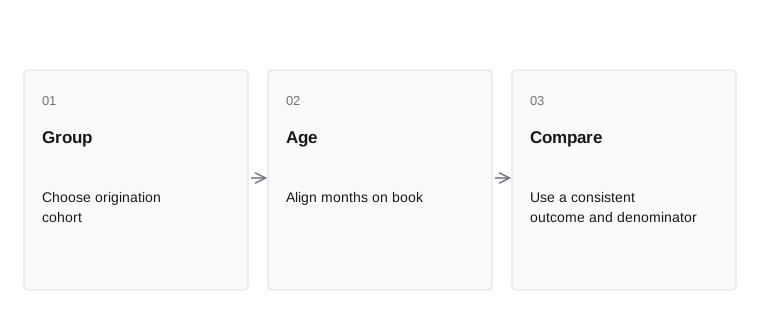
- GroupChoose origination cohort
- AgeAlign months on book
- CompareUse a consistent outcome and denominator
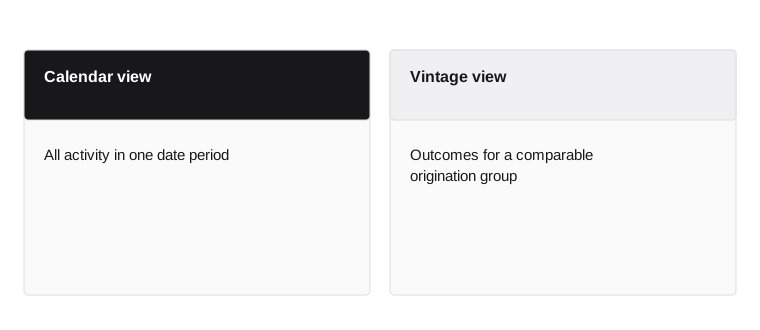
- Calendar view
- All activity in one date period
- Vintage view
- Outcomes for a comparable origination group
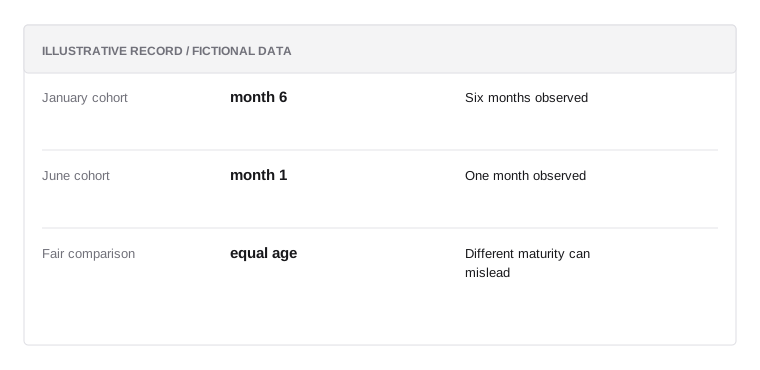
Vintage comparison
Illustrative data; not a real customer record or a prescribed policy.
- January cohortmonth 6
Six months observed
- June cohortmonth 1
One month observed
- Fair comparisonequal age
Different maturity can mislead
Losses develop over time
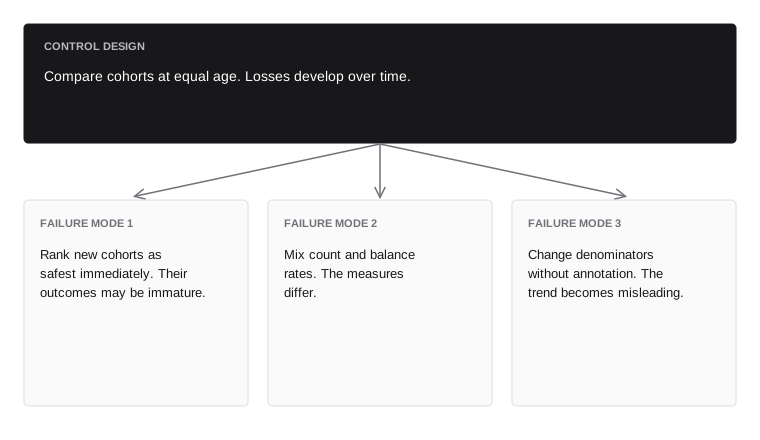
Compare cohorts at equal age. Losses develop over time.
- Failure mode 1avoid
- Rank new cohorts as safest immediately. Their outcomes may be immature.
- Failure mode 2avoid
- Mix count and balance rates. The measures differ.
- Failure mode 3avoid
- Change denominators without annotation. The trend becomes misleading.
Watch movement between states
A roll rate measures movement from one delinquency state to another over a defined period. Cure measures movement back toward current status. Both need clear state definitions and observation windows.
A borrower can make a payment and still remain delinquent if the payment does not satisfy the overdue obligation. Record contractual due amounts, payments, and allocation rules. Separate operational posting errors from actual repayment failure. A rising roll rate may signal economic stress, collection problems, or a data defect; investigate before selecting the response.
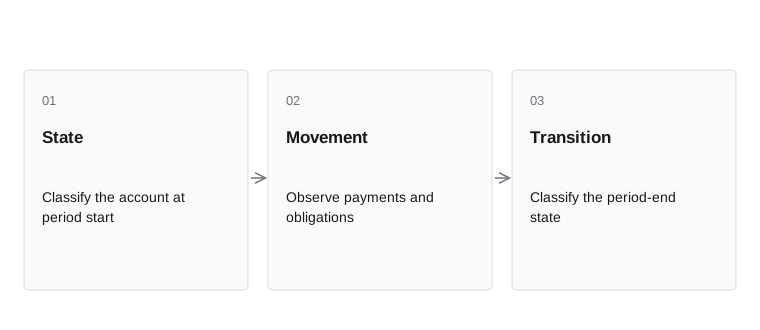
- StateClassify the account at period start
- MovementObserve payments and obligations
- TransitionClassify the period-end state
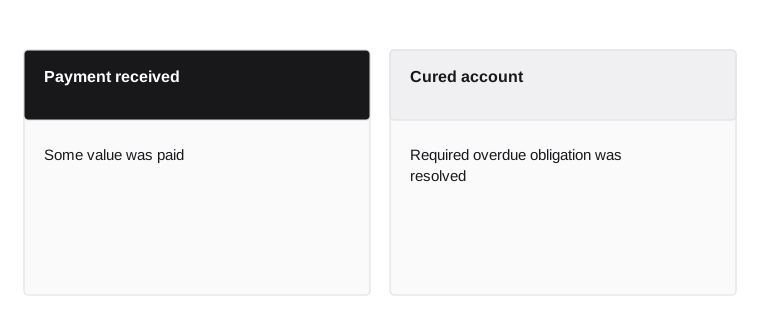
- Payment received
- Some value was paid
- Cured account
- Required overdue obligation was resolved
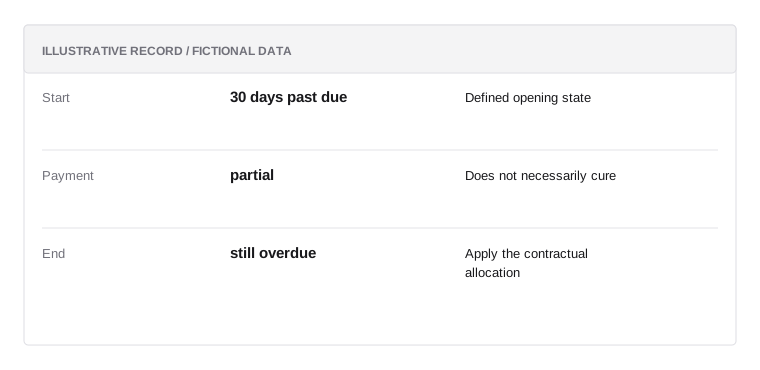
Delinquency transition
Illustrative data; not a real customer record or a prescribed policy.
- Start30 days past due
Defined opening state
- Paymentpartial
Does not necessarily cure
- Endstill overdue
Apply the contractual allocation
Any payment is not automatically a cure
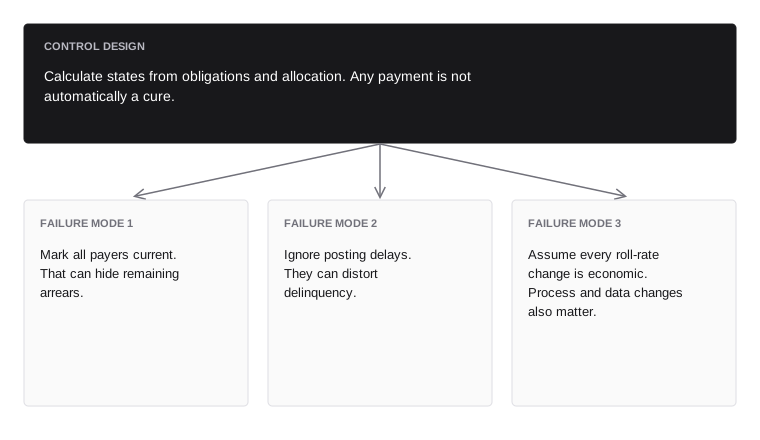
Calculate states from obligations and allocation. Any payment is not automatically a cure.
- Failure mode 1avoid
- Mark all payers current. That can hide remaining arrears.
- Failure mode 2avoid
- Ignore posting delays. They can distort delinquency.
- Failure mode 3avoid
- Assume every roll-rate change is economic. Process and data changes also matter.
Measure common exposures
Concentration can arise from industry, geography, supplier, platform, sponsor bank, or customer type. Two merchants with different names may depend on the same marketplace or logistics provider. Map shared dependencies alongside legal counterparties.
Set concentration measures in the units that matter: exposure, revenue, liquidity need, or operational capacity. A partner handling 60 percent of payouts creates a different issue from an industry holding 60 percent of credit exposure. Stress the relevant failure and assign an owner. Diversity in logos is not the same as diversity in failure modes.
Concentration can hide behind apparently different customers. Several merchants may depend on one supplier, one advertising channel, one acquiring partner, or one seasonal event. Their business names are different while their failure trigger is shared. A useful portfolio map records those common dependencies and tests a scenario in which the dependency fails. The response might involve limits, more available cover, a different payout schedule, or a planned reduction in new exposure. Diversification should describe independent loss drivers, not merely a large count of accounts.
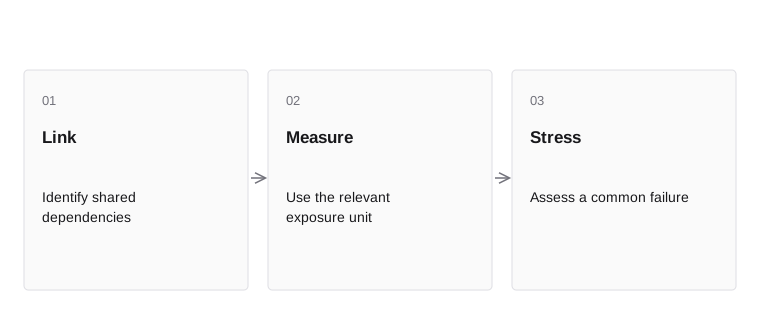
- LinkIdentify shared dependencies
- MeasureUse the relevant exposure unit
- StressAssess a common failure
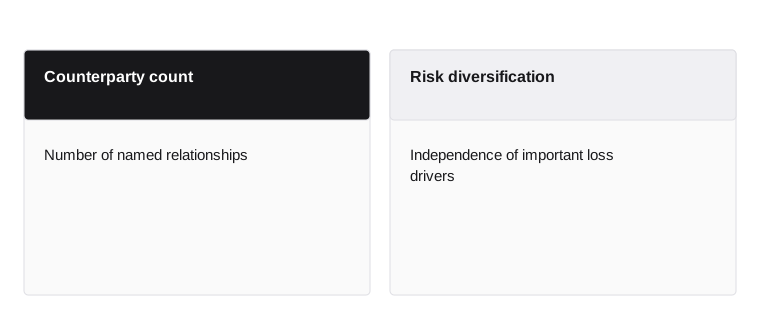
- Counterparty count
- Number of named relationships
- Risk diversification
- Independence of important loss drivers
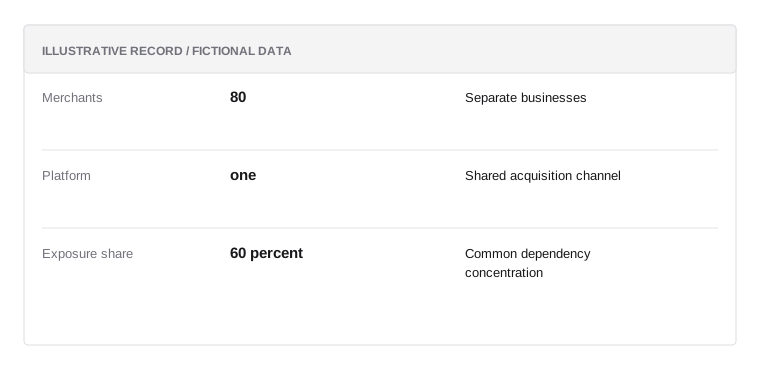
Concentration record
Illustrative data; not a real customer record or a prescribed policy.
- Merchants80
Separate businesses
- Platformone
Shared acquisition channel
- Exposure share60 percent
Common dependency concentration
Many entities can fail together
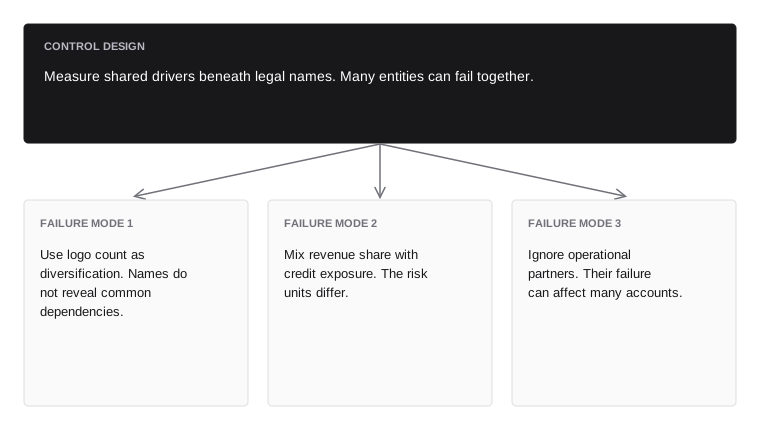
Measure shared drivers beneath legal names. Many entities can fail together.
- Failure mode 1avoid
- Use logo count as diversification. Names do not reveal common dependencies.
- Failure mode 2avoid
- Mix revenue share with credit exposure. The risk units differ.
- Failure mode 3avoid
- Ignore operational partners. Their failure can affect many accounts.
Use early warnings with a response
Declining receipts, rising refunds, growing delinquency, or changed settlement behavior can indicate deterioration. Each signal also has alternative explanations. Define the evidence needed to move from observation to action.
An early-warning program needs thresholds, owners, review cadence, and permitted responses. Avoid a queue that only produces alerts without decisions. Record whether an intervention helped, harmed, or had no clear effect. A limit reduction can reduce future exposure while creating customer consequences and notice duties. Apply the relevant process before changing terms.
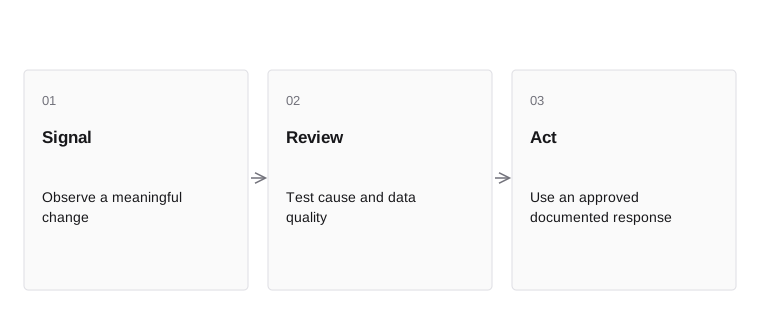
- SignalObserve a meaningful change
- ReviewTest cause and data quality
- ActUse an approved documented response
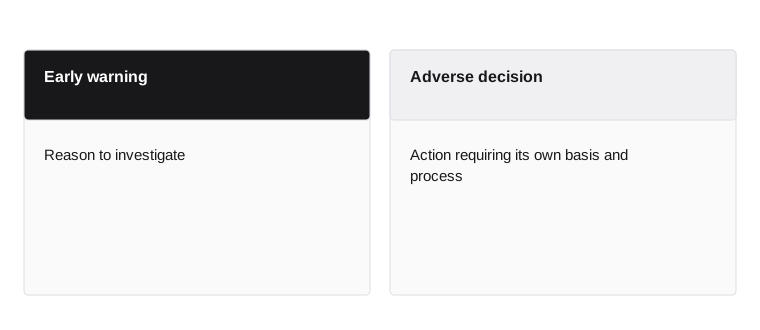
- Early warning
- Reason to investigate
- Adverse decision
- Action requiring its own basis and process
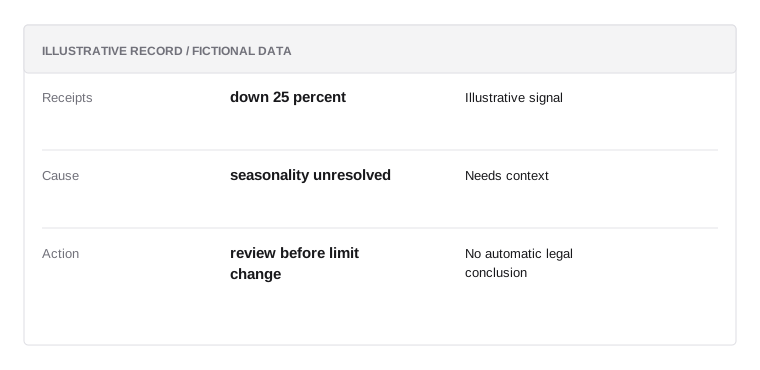
Deterioration review
Illustrative data; not a real customer record or a prescribed policy.
- Receiptsdown 25 percent
Illustrative signal
- Causeseasonality unresolved
Needs context
- Actionreview before limit change
No automatic legal conclusion
Signals need interpretation and a response
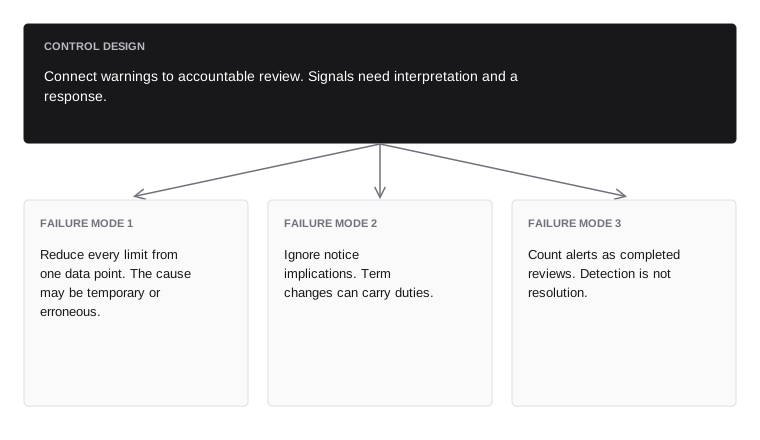
Connect warnings to accountable review. Signals need interpretation and a response.
- Failure mode 1avoid
- Reduce every limit from one data point. The cause may be temporary or erroneous.
- Failure mode 2avoid
- Ignore notice implications. Term changes can carry duties.
- Failure mode 3avoid
- Count alerts as completed reviews. Detection is not resolution.
Close, collect, and learn with care
Collections and account exit should preserve accurate balances, lawful communication, dispute routes, and access controls. A defaulted customer remains a person or business with rights. The objective is to resolve obligations without creating additional harm or misleading records.
Separate recoveries from new revenue and track collection costs. Feed mature outcomes back into underwriting with the original decision context. Do not train only on easy-to-collect accounts and generalize to everyone. Preserve the distinction between a loss caused by poor capacity analysis and a loss caused by a failed collection process.
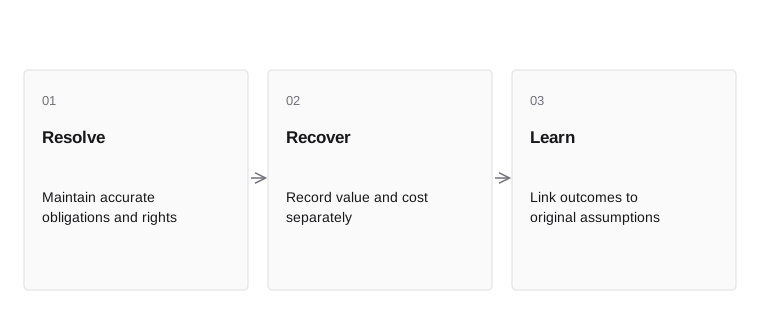
- ResolveMaintain accurate obligations and rights
- RecoverRecord value and cost separately
- LearnLink outcomes to original assumptions
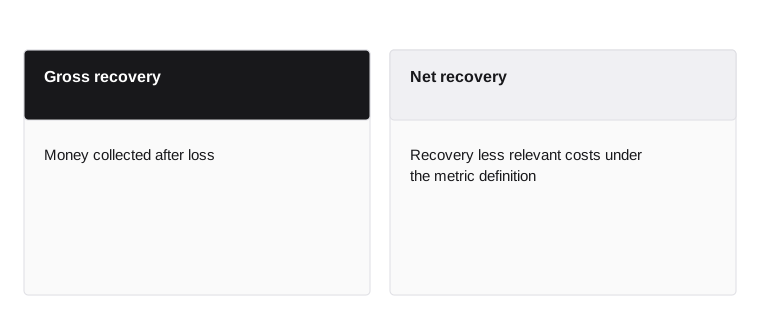
- Gross recovery
- Money collected after loss
- Net recovery
- Recovery less relevant costs under the metric definition
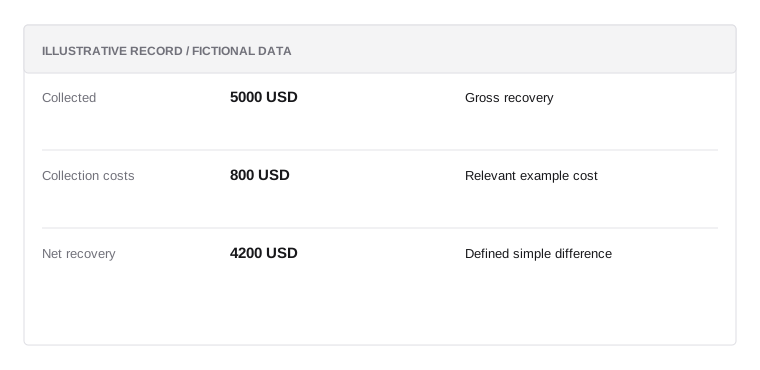
Recovery example
Illustrative data; not a real customer record or a prescribed policy.
- Collected5000 USD
Gross recovery
- Collection costs800 USD
Relevant example cost
- Net recovery4200 USD
Defined simple difference
Exit is part of the risk lifecycle
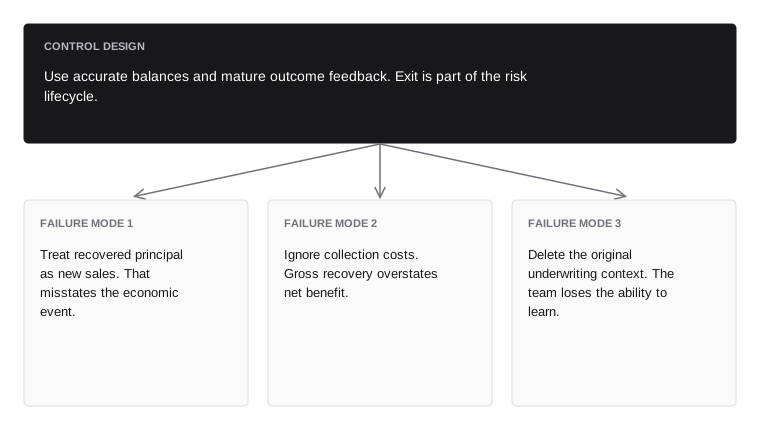
Use accurate balances and mature outcome feedback. Exit is part of the risk lifecycle.
- Failure mode 1avoid
- Treat recovered principal as new sales. That misstates the economic event.
- Failure mode 2avoid
- Ignore collection costs. Gross recovery overstates net benefit.
- Failure mode 3avoid
- Delete the original underwriting context. The team loses the ability to learn.
Chapter connections
This chapter builds on Reserves, limits, and payout policy. Use the glossary for terminology and risk mathematics for formulas and worked calculations.