Cash-flow analysis and financial evidence
Read financial records without confusing movement with income.
A bank account receives $30,000. It looks like revenue until the analyst sees that the money came from another account owned by the same business. Cash-flow underwriting is partly arithmetic and partly careful labeling.
Normalize before calculating
Classify inflows and outflows before computing a ratio. Internal transfers, loan proceeds, refunds, and customer revenue have different meanings. Repeated movement between accounts can inflate apparent activity without adding economic income.
Use stable transaction identifiers and a documented categorization process. Preserve raw descriptions for restricted review, but expose normalized categories downstream. Record confidence and allow correction. A merchant with unusual payment descriptions should not inherit a poor credit decision merely because a parser has never seen its industry. Validate categories against representative samples and financial records.
A bank feed contains movements of cash, not a ready-made income statement. Transfers between the same owner’s accounts can appear as new receipts. Borrowing can increase cash without increasing sales. A tax payment can make one month look unusually weak even when it reflects an obligation accumulated over several periods. Normalize these items with traceable rules and preserve the original transactions for review.
Missing coverage matters as much as classification. One connected account may exclude the account that pays wages or collects a large share of revenue. The analysis should state which accounts and periods it covers, how complete the data appears, and which conclusions depend on that coverage. A neat ratio calculated from an incomplete feed can be more misleading than an explicitly limited estimate.
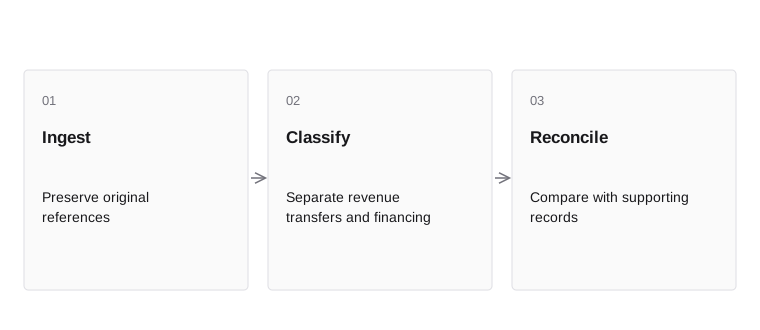
- IngestPreserve original references
- ClassifySeparate revenue transfers and financing
- ReconcileCompare with supporting records
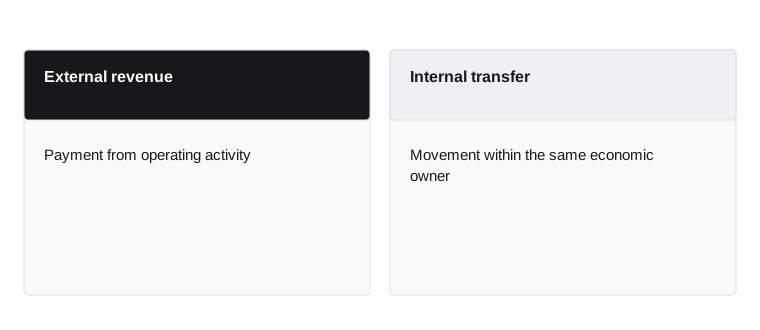
- External revenue
- Payment from operating activity
- Internal transfer
- Movement within the same economic owner
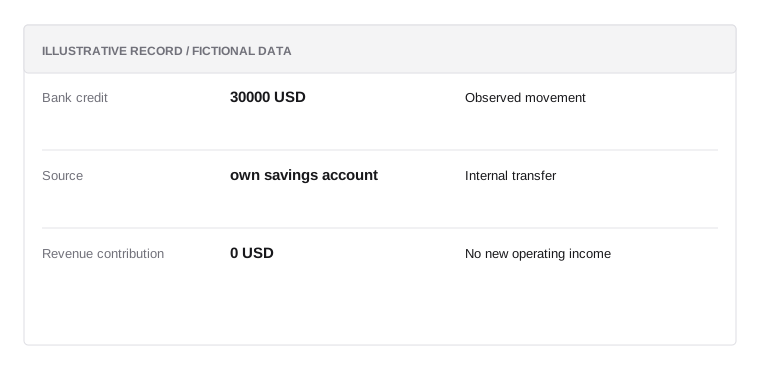
Inflow classification
Illustrative data; not a real customer record or a prescribed policy.
- Bank credit30000 USD
Observed movement
- Sourceown savings account
Internal transfer
- Revenue contribution0 USD
No new operating income
Movement is not new income
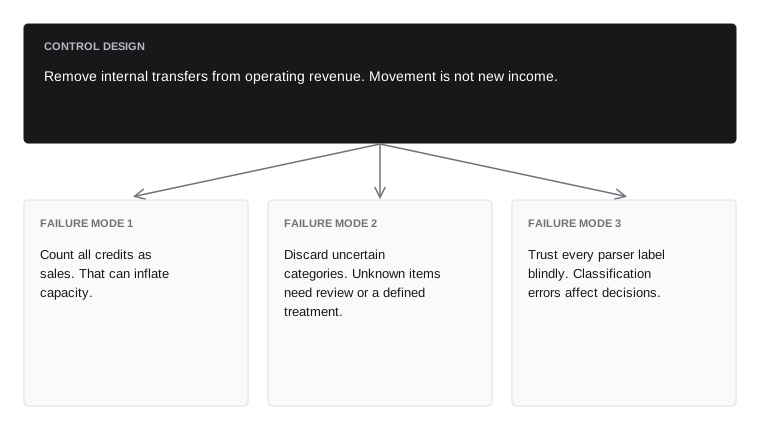
Remove internal transfers from operating revenue. Movement is not new income.
- Failure mode 1avoid
- Count all credits as sales. That can inflate capacity.
- Failure mode 2avoid
- Discard uncertain categories. Unknown items need review or a defined treatment.
- Failure mode 3avoid
- Trust every parser label blindly. Classification errors affect decisions.
Read the cash conversion cycle
A business can be profitable while cash is tied up in inventory or receivables. The cash conversion cycle connects inventory days, receivable days, and payable days. In a simplified model, inventory days plus receivable days minus payable days estimates the time cash is tied up.
For 40 inventory days, 30 receivable days, and 20 payable days, the cycle is 50 days. This is a teaching ratio, not a complete forecast. Seasonality, deposits, supplier terms, and uneven sales can change the practical need. Compare the cycle with the proposed financing term and actual cash ladder.
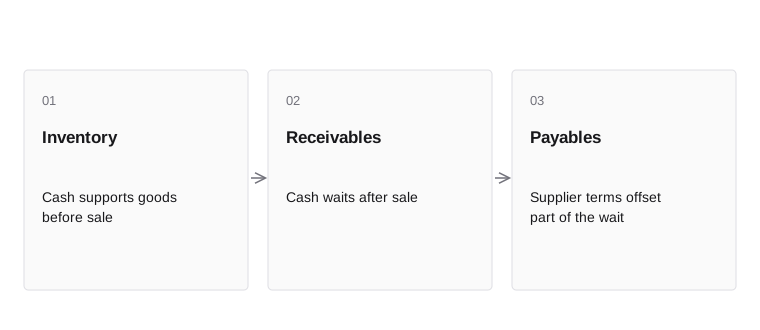
- InventoryCash supports goods before sale
- ReceivablesCash waits after sale
- PayablesSupplier terms offset part of the wait
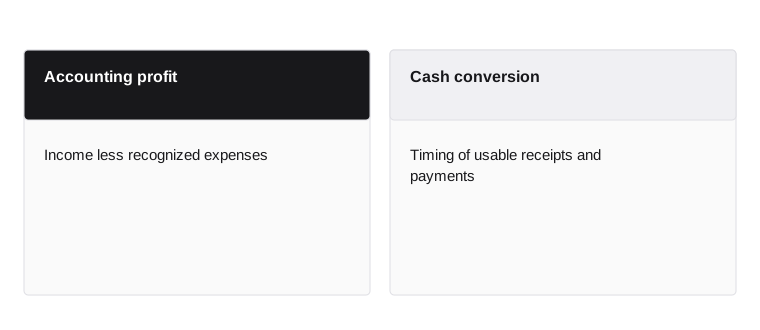
- Accounting profit
- Income less recognized expenses
- Cash conversion
- Timing of usable receipts and payments
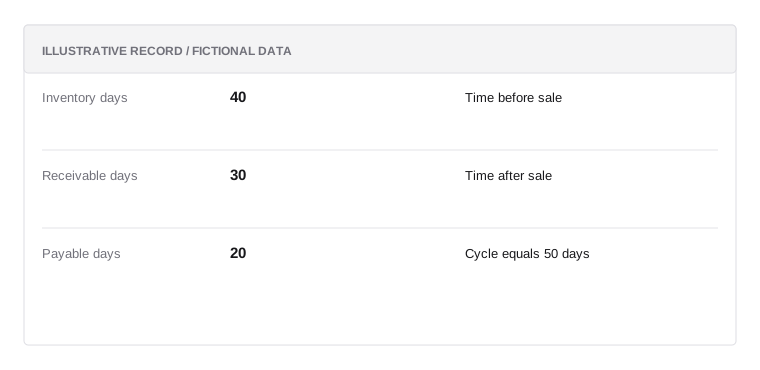
Cycle example
Illustrative data; not a real customer record or a prescribed policy.
- Inventory days40
Time before sale
- Receivable days30
Time after sale
- Payable days20
Cycle equals 50 days
Repayment timing should fit the operating need
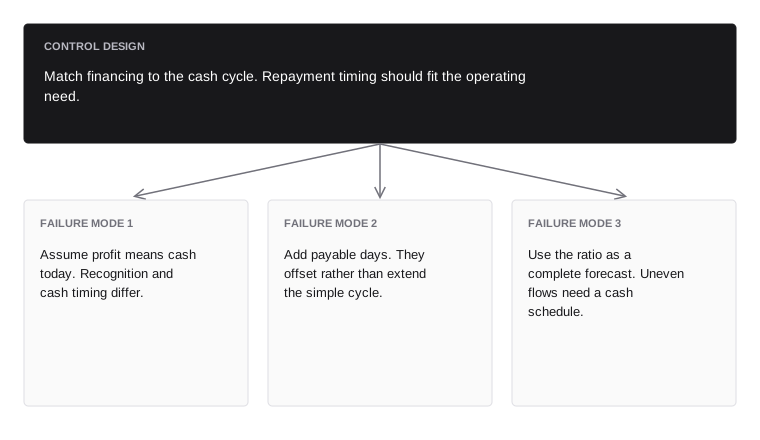
Match financing to the cash cycle. Repayment timing should fit the operating need.
- Failure mode 1avoid
- Assume profit means cash today. Recognition and cash timing differ.
- Failure mode 2avoid
- Add payable days. They offset rather than extend the simple cycle.
- Failure mode 3avoid
- Use the ratio as a complete forecast. Uneven flows need a cash schedule.
Stress the weak month
An annual average can hide months in which cash cannot cover obligations. Build monthly or weekly views appropriate to the business. Identify low periods, customer concentration, fixed costs, and delayed receipts. Use documented assumptions rather than a single unexplained stress percentage.
A seasonal seller may earn most revenue before holidays and pay suppliers months earlier. Financing that amortizes evenly can create pressure during the low season. Test the proposed schedule against that pattern. A stress case should show the path from changed assumptions to a cash shortfall so the decision can be challenged.
Consider a seasonal seller with strong annual sales and a cash trough before the holiday period. An annual average can imply comfortable debt service while the business cannot meet a payment in its weakest month. Build a simple time-based cash forecast using opening cash, expected receipts, essential payments, and debt service. Then change the assumptions that matter: delayed customer payments, slower stock turnover, or a large supplier deposit. The point is to locate the timing of a shortfall and the available response, not to make one precise forecast appear certain.
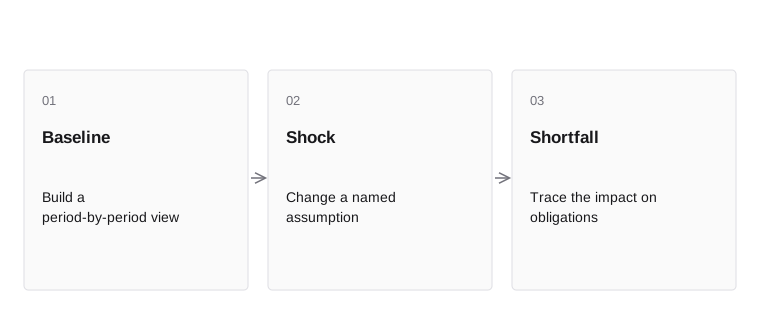
- BaselineBuild a period-by-period view
- ShockChange a named assumption
- ShortfallTrace the impact on obligations
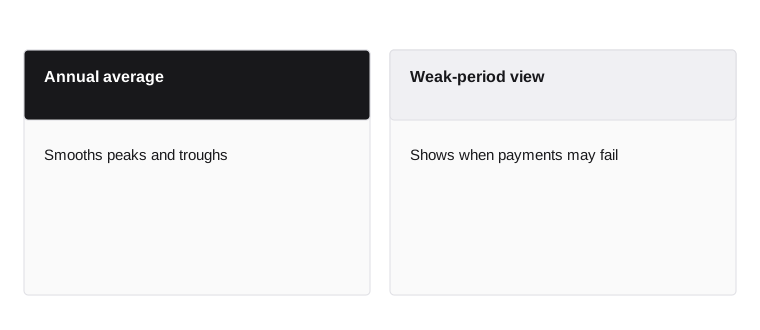
- Annual average
- Smooths peaks and troughs
- Weak-period view
- Shows when payments may fail
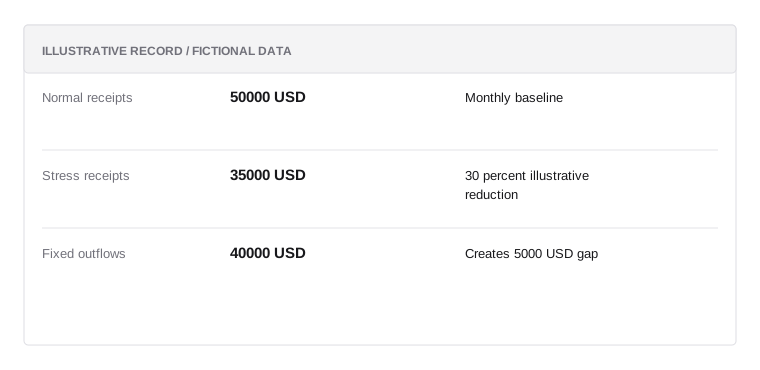
Seasonal stress
Illustrative data; not a real customer record or a prescribed policy.
- Normal receipts50000 USD
Monthly baseline
- Stress receipts35000 USD
30 percent illustrative reduction
- Fixed outflows40000 USD
Creates 5000 USD gap
Averages can hide a payment shortfall
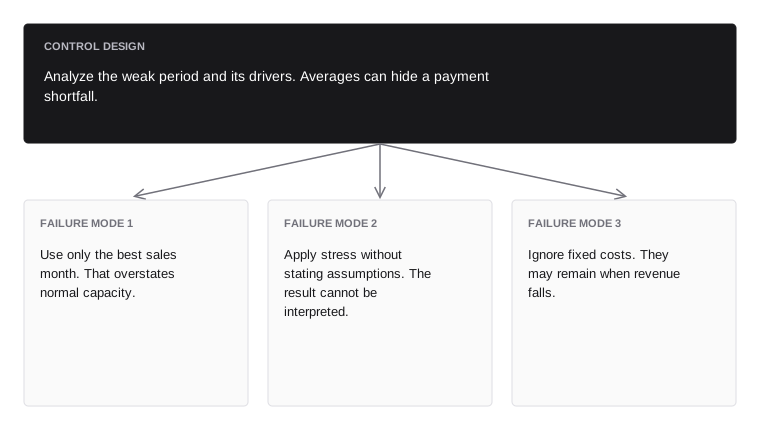
Analyze the weak period and its drivers. Averages can hide a payment shortfall.
- Failure mode 1avoid
- Use only the best sales month. That overstates normal capacity.
- Failure mode 2avoid
- Apply stress without stating assumptions. The result cannot be interpreted.
- Failure mode 3avoid
- Ignore fixed costs. They may remain when revenue falls.
Reconcile cash and accounting views
Bank transactions, management accounts, tax records, and financial statements can describe different periods and bases. Reconcile the differences before treating disagreement as deception. Accrual revenue may precede receipt; a loan payment includes principal that is not an ordinary operating expense in an income statement.
Create a bridge between reported earnings and cash available under the underwriting definition. Label non-cash items, working-capital movement, and financing flows. Use consistent periods. A clean bridge does not prove the business is safe, but an unexplained bridge makes the capacity estimate difficult to trust.
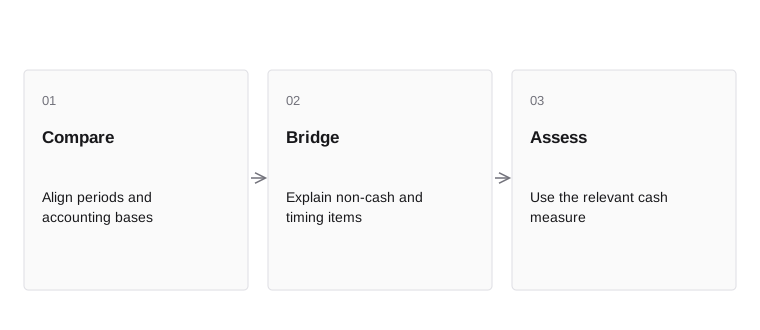
- CompareAlign periods and accounting bases
- BridgeExplain non-cash and timing items
- AssessUse the relevant cash measure
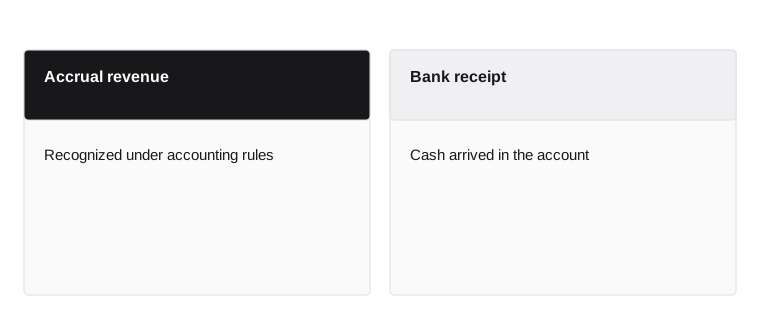
- Accrual revenue
- Recognized under accounting rules
- Bank receipt
- Cash arrived in the account
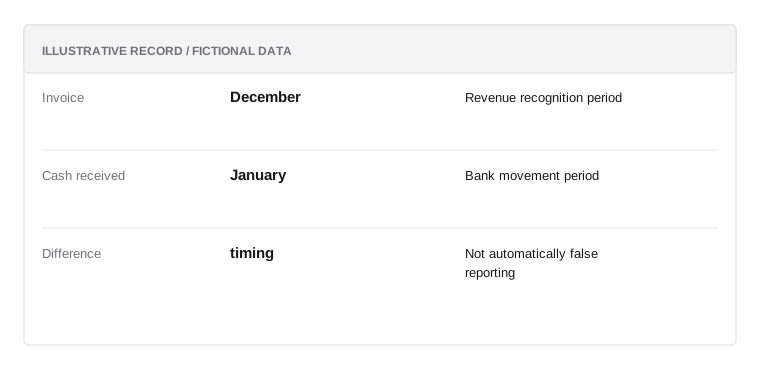
Reconciliation bridge
Illustrative data; not a real customer record or a prescribed policy.
- InvoiceDecember
Revenue recognition period
- Cash receivedJanuary
Bank movement period
- Differencetiming
Not automatically false reporting
Different records can both be correct
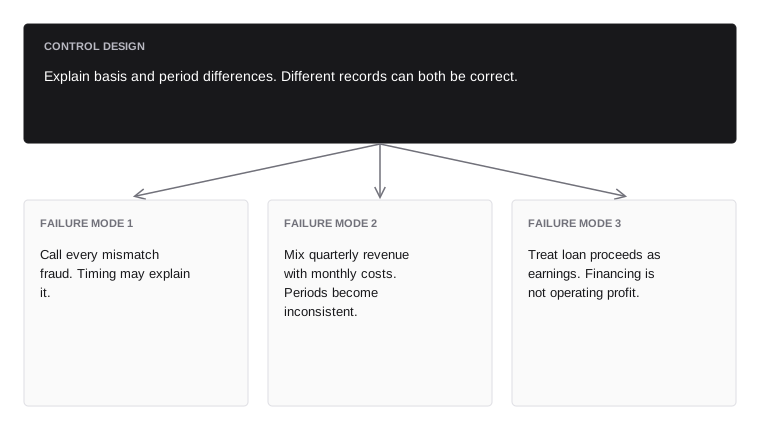
Explain basis and period differences. Different records can both be correct.
- Failure mode 1avoid
- Call every mismatch fraud. Timing may explain it.
- Failure mode 2avoid
- Mix quarterly revenue with monthly costs. Periods become inconsistent.
- Failure mode 3avoid
- Treat loan proceeds as earnings. Financing is not operating profit.
Use financial data with consent and limits
Financial records reveal more than repayment capacity. They may expose health, family, location, or other sensitive patterns. Define permitted use, access, retention, and correction. A data connection does not mean every available field should become a model feature.
Track source coverage and outages. An empty feed can mean no activity, a disconnected account, or a provider error. Provide a clear path for customers to supply valid alternative evidence where the product permits it. Keep the distinction between data availability and creditworthiness visible to decision makers.
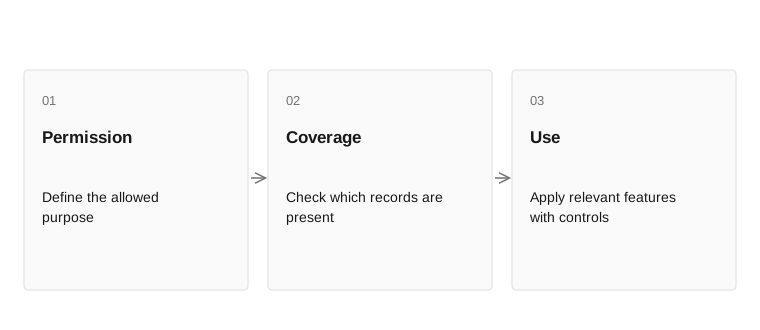
- PermissionDefine the allowed purpose
- CoverageCheck which records are present
- UseApply relevant features with controls
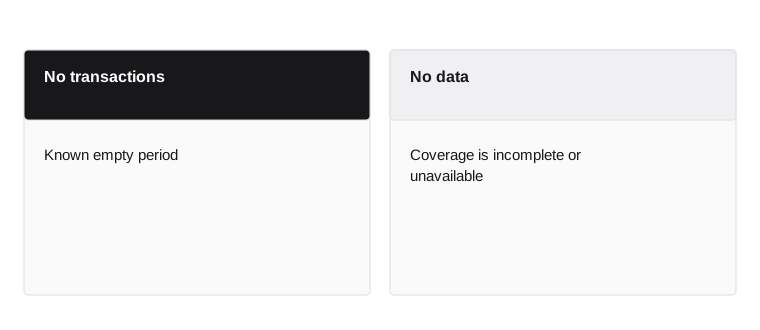
- No transactions
- Known empty period
- No data
- Coverage is incomplete or unavailable
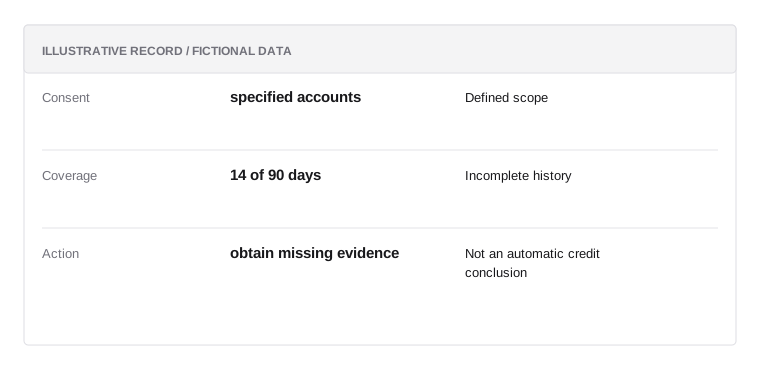
Data connection record
Illustrative data; not a real customer record or a prescribed policy.
- Consentspecified accounts
Defined scope
- Coverage14 of 90 days
Incomplete history
- Actionobtain missing evidence
Not an automatic credit conclusion
Missing records do not prove no income
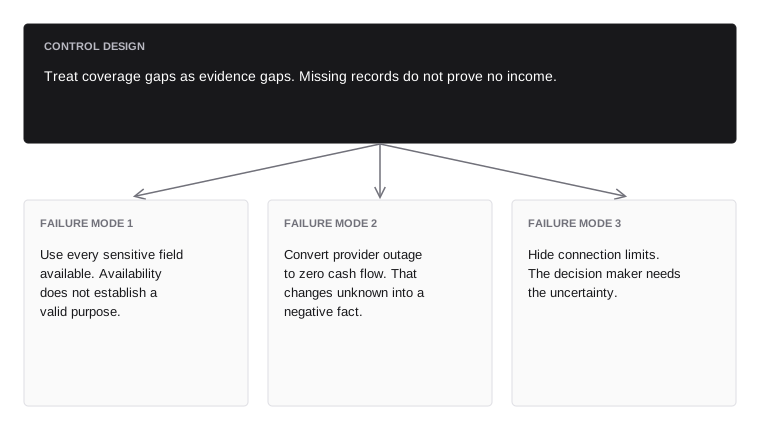
Treat coverage gaps as evidence gaps. Missing records do not prove no income.
- Failure mode 1avoid
- Use every sensitive field available. Availability does not establish a valid purpose.
- Failure mode 2avoid
- Convert provider outage to zero cash flow. That changes unknown into a negative fact.
- Failure mode 3avoid
- Hide connection limits. The decision maker needs the uncertainty.
Chapter connections
This chapter builds on Credit risk and repayment capacity. Continue with Reserves, limits, and payout policy to follow the next part of the system. Use the glossary for terminology and risk mathematics for formulas and worked calculations.